5 Ways that Delighting Your Customers Builds Your Brand's Story
April 20, 2016

When your marketing budget and team are stretched thin, how do you decide what stays and what goes? I’ve observed that companies who feel they have to compromise in order to make the most of limited resources are doing so by reducing their focus on existing customers.
But is this wise? Delighting customers isn’t just about rolling good service into your marketing operations; it’s a strategic tool for building and sustaining your brand. A delighted customer is a channel by which you can find new opportunities for revenue and even for product improvements.
Not sure how delighting your customers builds your brand and grows your business? Here are the top five reasons to view customer delight as an important strategic goal for your inbound marketing plan this year.
1. Delighted Customers Become Brand Advocates
A customer who is delighted with your brand becomes somebody who is going to tell everyone around them how great you are. Happy customers become amplifiers for your company’s message. Not only that, they are amplifiers who are likely to be communicating very specifically with people similar to themselves, meaning there is a high probability that a customer who endorses you will be endorsing you to a member of one of your buyer personas.
In addition to developing that nebulous thing we call brand awareness, positive word of mouth referrals very often come into play when a prospect is weighing two or more competing options. That means growing these referrals should be a key part of your inbound marketing plan.
Thanks to the hyper-saturation of marketing and advertising today, we know that it now takes multiple, multiple mentions of a brand before somebody is willing to contact and consider them. When many of those mentions come from one or more trusted sources (such as colleagues or friends) the time and effort that it takes to accumulate enough referrals for a new prospective customer to see your brand as reliable is shortened considerably.
2: Delighted Customers Grow Repeat Business
A delighted customer is a customer who is more receptive to purchasing again, agreeing to an upsell opportunity, or extending an existing contract. While new business growth is a critical feature of every business development plan, ignoring opportunities for new or additional recurring recurring revenue from existing customers leaves a massive gap in your revenue planning.
Building an ongoing positive relationship with every client or customer is the only way to guarantee ongoing sales success. No matter how good your product may be, if your customers feel unappreciated or mistreated or forgotten then at the end of the day they are likely to eventually abandon you for someone else.
3. It's Good for Your Inbound Marketing Strategy
You probably already know that delighting customers is supposed to be an important element in any inbound marketing plan. But, do you know why?
Delighted customers are an important source of content, inbound links, social media and domain authority. Not only that, they can help increase or widen the distribution of marketing assets such as ebooks, case studies, and blog posts.
A customer who is engaging your brand and content with enthusiasm becomes a channel for marketing throughout their contact network. Because these referrals are not sponsored, and are often spontaneous, they carry significant weight with peers who may be approaching the intent or decision stage of a buying decision.
4. It Can Help Improve Your Product
Delighted customers often engage not only as brand advocates but as internal support and advisors as well. Someone who knows, trusts, and believes in your product and team is more likely to share ideas and observations about how it can be improved. Thoughtful feedback from an active user or other consumer can provide insights into potential upgrades and improvements that will not only build your product but your brand itself by extension. Similar insights from focus groups or consultants can be extremely costly. By listening to and engaging with a delighted customer, you can achieve insight into your core buyer personas for free.
Cultivating a relationship with your customer base allows you to build a brain trust of thoughtful end-users. Often, their insights can tell you things about your product that you would otherwise be completely ignorant of, revealing areas of improvement and opportunity that are ready and waiting for you to engage with them.
5. It Can Boost Social Proof
Several clients have asked me recently whether testimonials on a website or company page are worth pursuing from an inbound perspective. My answer to them is always yes, for several reasons.
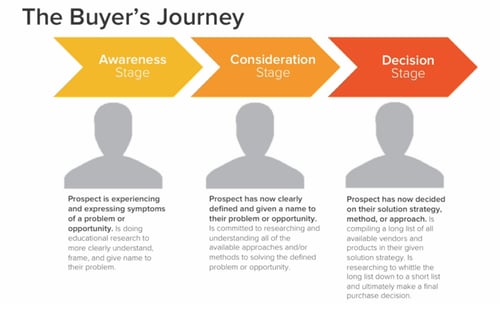
A published testimonial or review often provides a comforting point of reference for somebody at the very beginning of the Consideration stage of their buyer’s journey. This isn’t easy to quantify. It's difficult to measure, short of asking directly, how influential referrals can be. When I have asked newly signed customers and clients, nearly all of them have mentioned reading a review or referral near the beginning of their buying process as a contributing factor in their ultimate decision.

Searching for your brand or long-chain keywords does not always lead first to your company page. The more places your brand is mentioned and endorsed by users or customers, the more likely that searches will direct prospects to a positive endorsement.
Across the Board, it’s Good Business
At the end of the day, it’s worth your while to delight customers simply for the sake of delighting customers. Good service and a positive relationship with every client are keys to a great reputation and a satisfying job. Feeling good about what you do tends to make you better at doing it.
But even if virtue wasn’t its own reward, excellence and thoughtfulness in your customer relationships go beyond good ethics: they’re good business. The business, loyalty, and feedback of your customers are can’t-miss elements in building a reputable and sustainable brand, no matter what that brand is.
What are your favorite benefits of having a delighted customer?Join the conversation and let us know what you think!
About the author
Bethany Jurns was formerly a Senior Consultant for SmartBug Media. She combines a background in creative writing with a passion for technology and data-driven strategy to help companies grow their business and realize their full marketing potential. Read more articles by Bethany Jurns.


